
Counts maps can only be generated from within an individual property. Learn how to navigate to a property here.
What is a Count Map?
A Landkind count map is a PDF report generated for an individual property. It shows counts for a selected season and count type, and includes a map of the counts, a table summarising the count data, and a graph to visualise the average density per m2 for each block.
How do I generate a Count Map?
-
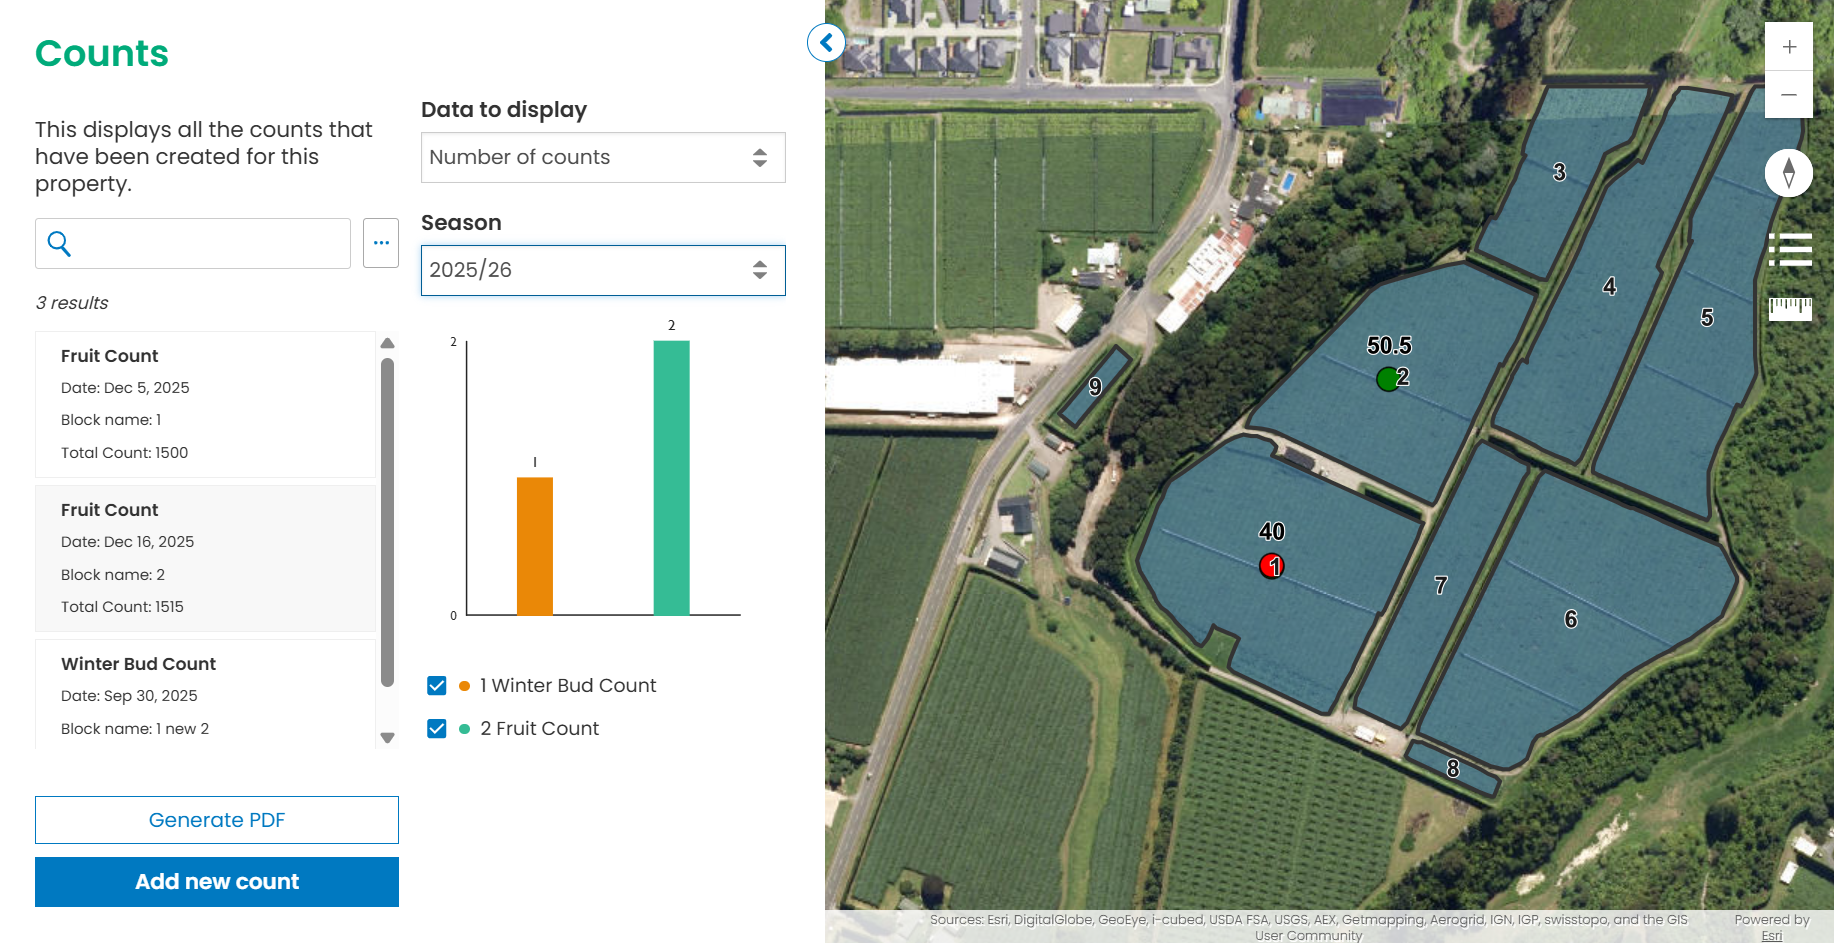
To generate your Count Map, first select a property and go to the Counts workflow.
-
On the Counts workflow, you should see a button ‘Generate PDF’. Click this to take you to the Generate PDF page.
If you don’t see the ‘Generate PDF’ button, you may not have the permissions required. Please contact your administrator or contact support.
-
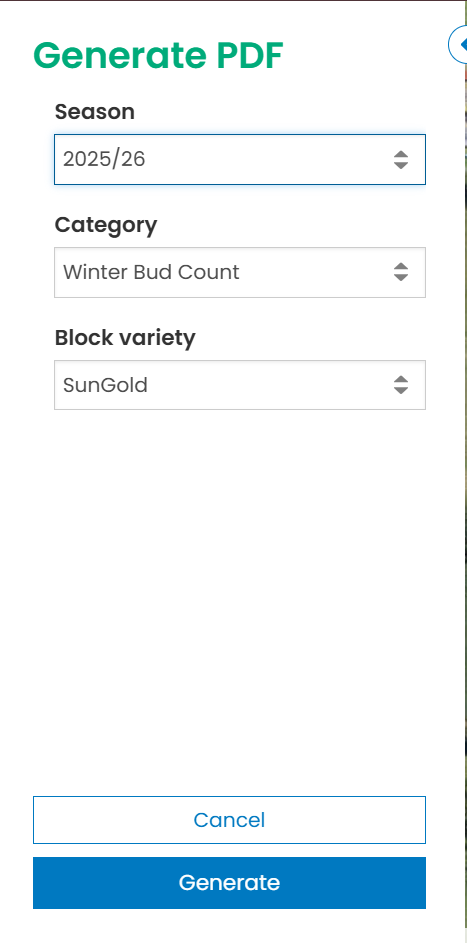
On the Generate PDF page, you should see a selection of filters. These include dropdowns for season, variety, and count type. Select the combination of filters you wish to create a Count Map for, and click ‘Generate’.
-
Once your map has been generated, you will see a list of downloads available, below the filters on the Generate PDF page. Click on these to download your maps.
Your finished map will look something like this:
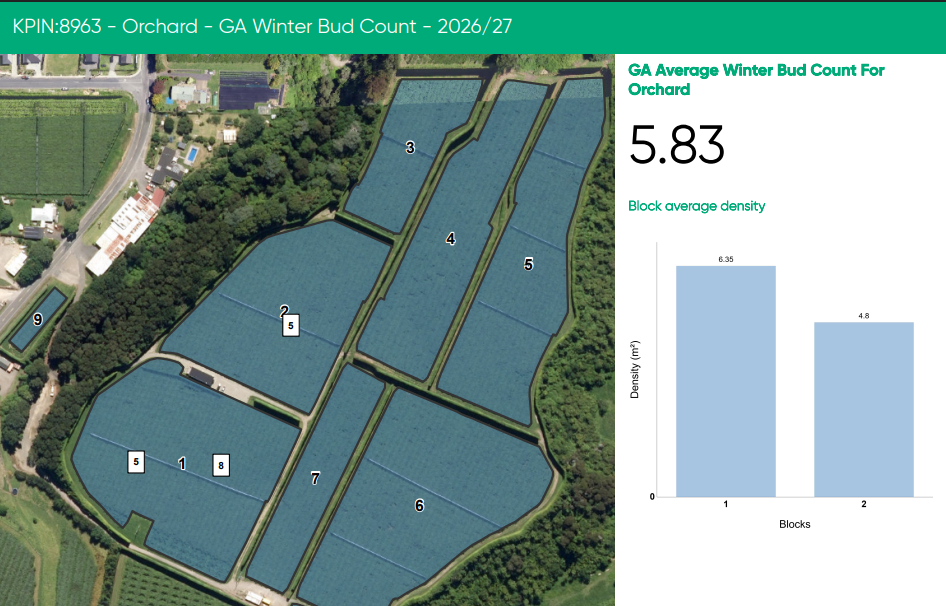
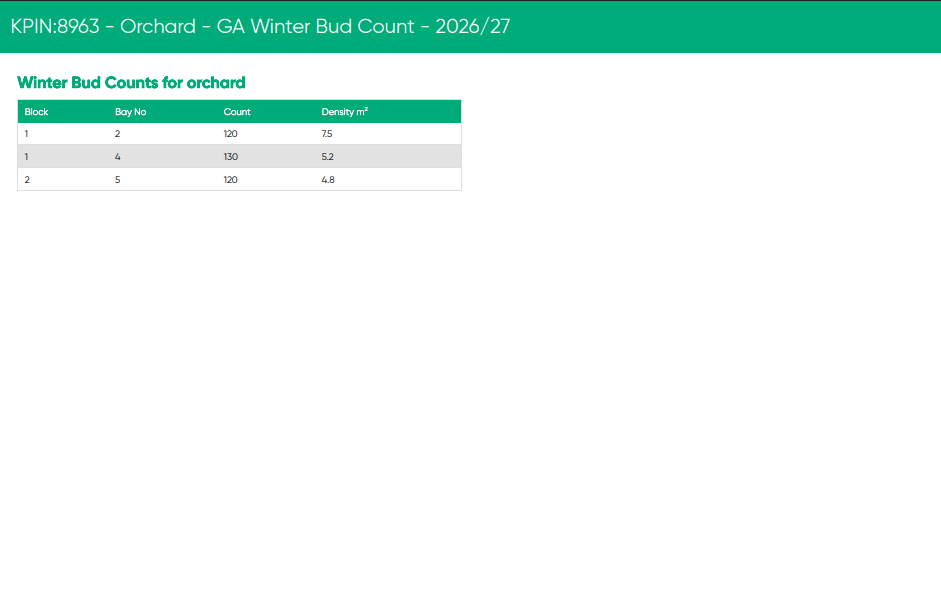
Your map has been configured to use your organisation’s logo and colours. If these don’t look right, please contact your administrator or get in touch with Landkind support.